About XDI

Our goal is to accelerate action on climate change by embedding physical climate risk data in all decisions
As the physical climate risk experts, we’re here to help you - whether at the start of your journey, or advanced, we deliver actionable results.
We’re independent
XDI is part of The Climate Risk Group, a group of companies committed to quantifying and communicating the costs of climate change.
We’re serious about climate
Ours is a mission-driven company.
We exist to help our clients and community understand and manage unavoidable climate change, whilst demonstrating the imperative for a low carbon world.
We see every contract as a collaboration. We are trusted by governments, NGOs, companies, banks and communities - and while some see themselves in opposite corners - we believe it will take all actors working together to solve this challenge.
We’ve got heart
Data and information alone do not create change: data needs humanity and humanity needs ambition.
Our vision is not just to identify physical climate risks, but to also mitigate them.
Our goal is a more climate-resilient community.
Our approach is to work with you over the course of your climate risk journey.
Our clients are global
We analyse assets in over 175 countries

Adapt and thrive in a climate changing world

Our story
Climate Risk Pty Ltd is founded
Working with leading edge decision-makers and organisations, we developed systems to calculate the impact of climate change variables on physical assets, human resources and management processes.
XDI is incorporated
XDI (Cross Dependency Initiative) brings together the knowledge, the technology and the team to accelerate action on climate change by embedding climate impact data in all decisions.
Climate Valuation launched
XDI’s sister company, Climate Valuation is established, putting climate change impact information into the hands of homeowners and homebuyers.
The Climate Risk Group
The Climate Risk Group is formed bringing together XDI and Climate Valuation under one parent company, to quantify and communicate the costs of climate change.
Our founders, Rohan, Ruth and Karl

Passionate about shifting the dial on climate change, our founders from left-to-right:
Rohan Hamden, Ruth Tedder and Karl Mallon.
Global leaders in physical climate risk analysis since 2007
Backed by a team of specialists across science, engineering and software development, XDI provides best in class expertise in physical climate risk analysis to inform capital allocation, planning and risk management decisions.
Our work helps key decision makers understand the costs of unmitigated climate change at the asset, firm and investor scale.
Today, XDI is an international company with offices in Europe and Australia.
We’re always looking for dedicated climate specialists
If you’re passionate about accelerating action on climate change, but don’t see a relevant open position, email us with some information about yourself

The XDI team, your physical climate risk experts

Our data has been tested by the demands of the global market since 2007


The Climate Risk Engines have driven innovation in defining, pricing and responding to physical climate risk.
The Climate Risk Engines extract dynamically downscaled global and regional climate change models and combine these with global and local data sets, applying bespoke probabilistic algorithms to produce decision-ready financial and risk metrics.
Results are expressed in a range of engineering or financial metrics to inform decision-making at all scales.
Award winning technology
A recent independent market survey ranked XDI the highest for:
- hazards covered
- geographical reach
- capacity for analysis of large number of assets

Our technology: the Climate Risk Engines
The Climate Risk Engines were created in 2012.
Developed by scientists, engineers and climate risk experts, this was the first time the cost of physical climate risk had been quantified in this way.
Today, the Climate Risk Engines are one of the most flexible, powerful and trusted sources of physical climate risk data in the world.
The Climate Risk Engines use engineering-based methods to assess exposure and vulnerability of asset archetypes to understand the likely damage and failure probability of assets caused by extreme weather and climate change hazards.
The coverage is global, granular, sophisticated and under constant improvement.

Our hazards
The Climate Risk Group’s science team is continually adding new hazards to our analysis. We prioritise those that have the greatest impact on people, business and finance, and the widest application.
Coastal Inundation
Extreme Heat
Extreme Wind
Riverine Flooding
Forest Fire
Freeze-Thaw Cycle
Hurricane & Cyclone
Landslip *
Surface Water Flooding
Soil Movement
Tropical Cyclone Storm Surge *
* in development

Our latest data release
At XDI, we believe that data needs to be in the hands of those who will use it to drive change, including citizens and civil society organisations. We release information publicly to generate debate and increase understanding.

2024 XDI Gross Domestic Climate Risk Report
PUBLIC DATA RELEASE
Climate change and sovereign risk
The 2024 XDI Gross Domestic Climate Risk Dataset ranks over 2,600 jurisdictions around the world in 2050 according to modelled projections of damage to the built environment from extreme weather and climate change including from flooding, forest fires and sea level rise. It also identifies which of these jurisdictions see the greatest escalation of modelled damage from 1990 to 2050.
This is the first time there has been a physical climate risk analysis focused exclusively on the built environment, comparing every state, province and territory in the world. Since extensive built infrastructure generally overlaps with high levels of economic activity and capital value it is imperative that the physical risk of climate change is appropriately understood and priced.
The XDI Gross Domestic Climate Risk comparison of physical climate risk for 2050 found:
- Two of China’s largest sub-national economies – Jiangsu and Shandong – top the global ranking, in first and second place. Over half of the provinces in the global top 50 are in China.
- After China, the US has the most high-risk states with 18 states in the top 100. Florida is the highest-ranking US state, followed by California and Texas.
- Together, China, India and the US make up over half the states and provinces in the top 100.
- Other highly-developed and globally-significant economic hubs in the top 100 include Buenos Aires, São Paolo, Jakarta, Beijing, Hồ Chí Minh City, Taiwan and Mumbai.
- Australia, Belgium, Italy, Canada and Germany also have states and provinces in the top 100.
- South East Asia experiences the greatest escalation in damage from 1990 to 2050 anywhere in the world.
- Globally, most damage is caused by riverine and surface flooding or flooding combined with coastal inundation.

Top 50 states and provinces ranked by aggregated risk from climate change hazards in 2050 under RCP8.5
NOTE: entities not on this list are not “low risk.” There are many states and provinces facing high risk from extreme weather climate change hazards not appearing at the top of this ranking due to their lower number of residential, commercial and industrial buildings.

Asia Overview
Asia dominates the list of provinces at risk by Aggregated Damage Ratio, with more than half (114) of the top 200 in 2050 in this region.
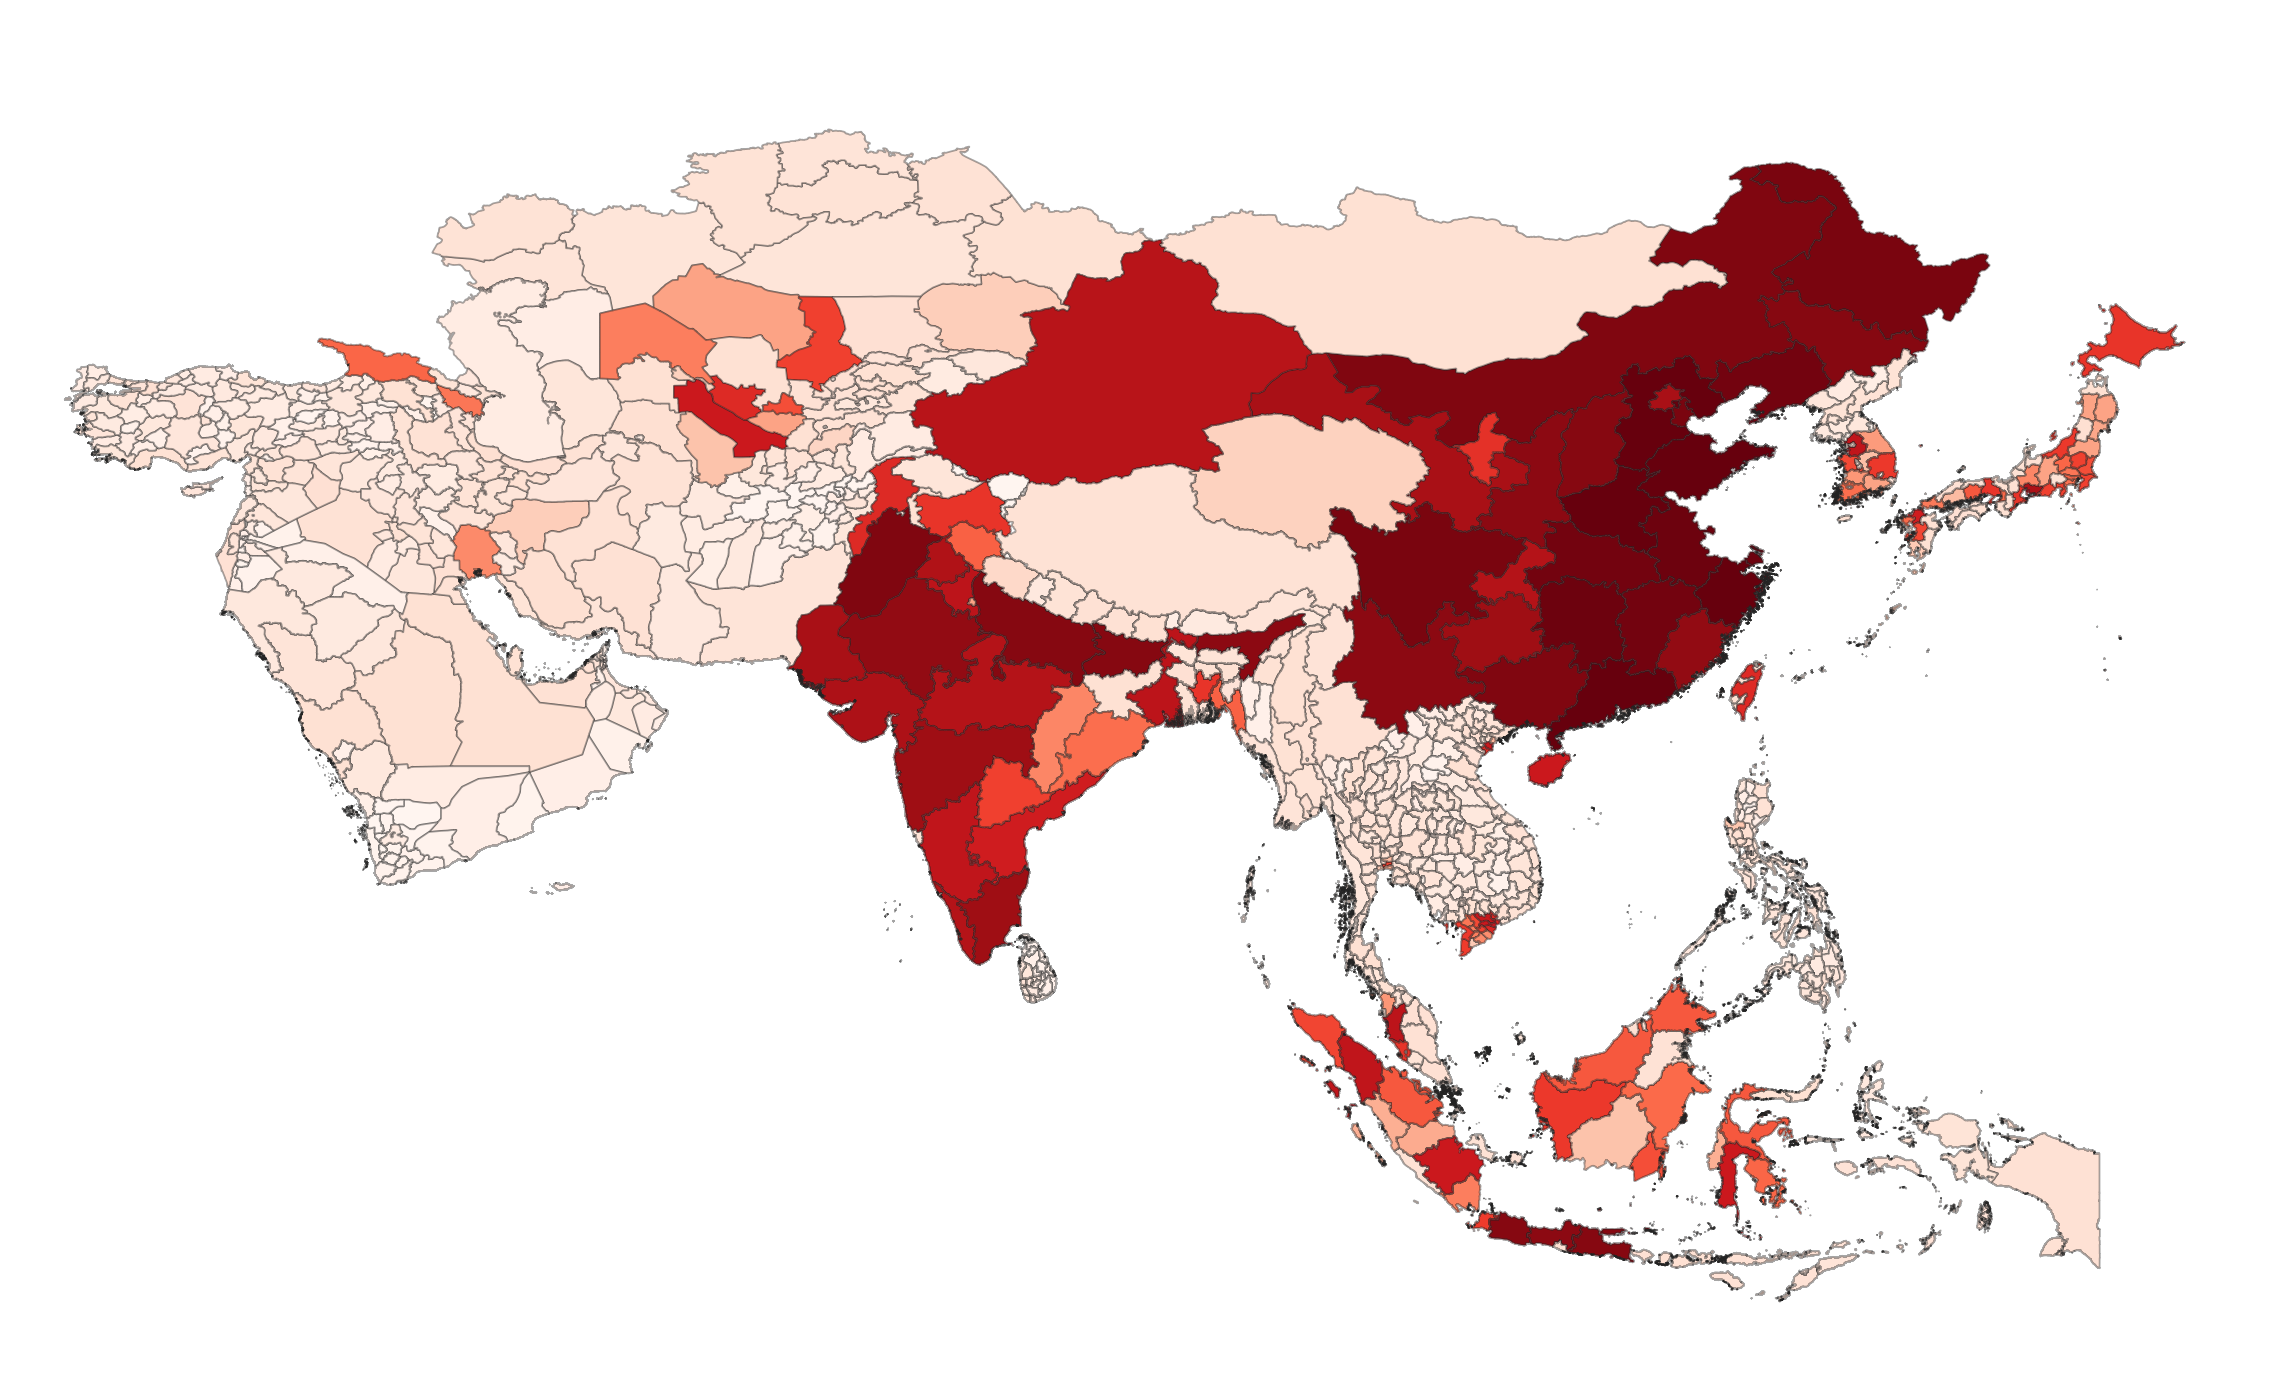
Key Findings:
- More than a quarter (54) of these are in
East Asia: 29 in China, 20 in Japan and 4 in South Korea. - 36 of the top 200 are in South East Asia, notably Vietnam and Indonesia.
- South Asia has 24 of the top 200. After China, India has the highest number of states in the top 50 (9), with Punjab, Bihar, Uttar Pradesh and Assam ranking highest. Pakistan also has multiple provinces in the top 100, including Sindh province. Devastating flooding between June and August 2022 affected 30 per cent of the area of Pakistan and has partially or fully damaged more than 900,000 houses in Sindh province.
- East Asia and South East Asia see the greatest increase in Average Damage between 1990 and 2050, and China in particular has many provinces with the greatest overall Aggregated Damage Ratio. This increase and overall risk to the built environment in 2050 is driven predominately by sea level rise and secondarily by flooding risk” in the Asia section should read “by flooding and coastal inundation.
- The analysis highlights the vulnerability of major cities in East Asia and South East Asia including Jakarta, Beijing, Hồ Chí Minh City and Taiwan.
China
China has 29 states in the top 100 in 2050 and 26 of these are in the top 50. Globally, the Chinese provinces Jiangsu, Shandong, Hebei, Guangdong and Henan have the highest results for Aggregated Damage Ratio in 2050 of any of the provinces and territories in this analysis. This is because these provinces are large, they host extensive industrial, trade, residential and commercial development and are exposed to coastal sea level rise and riverine and surface flooding.
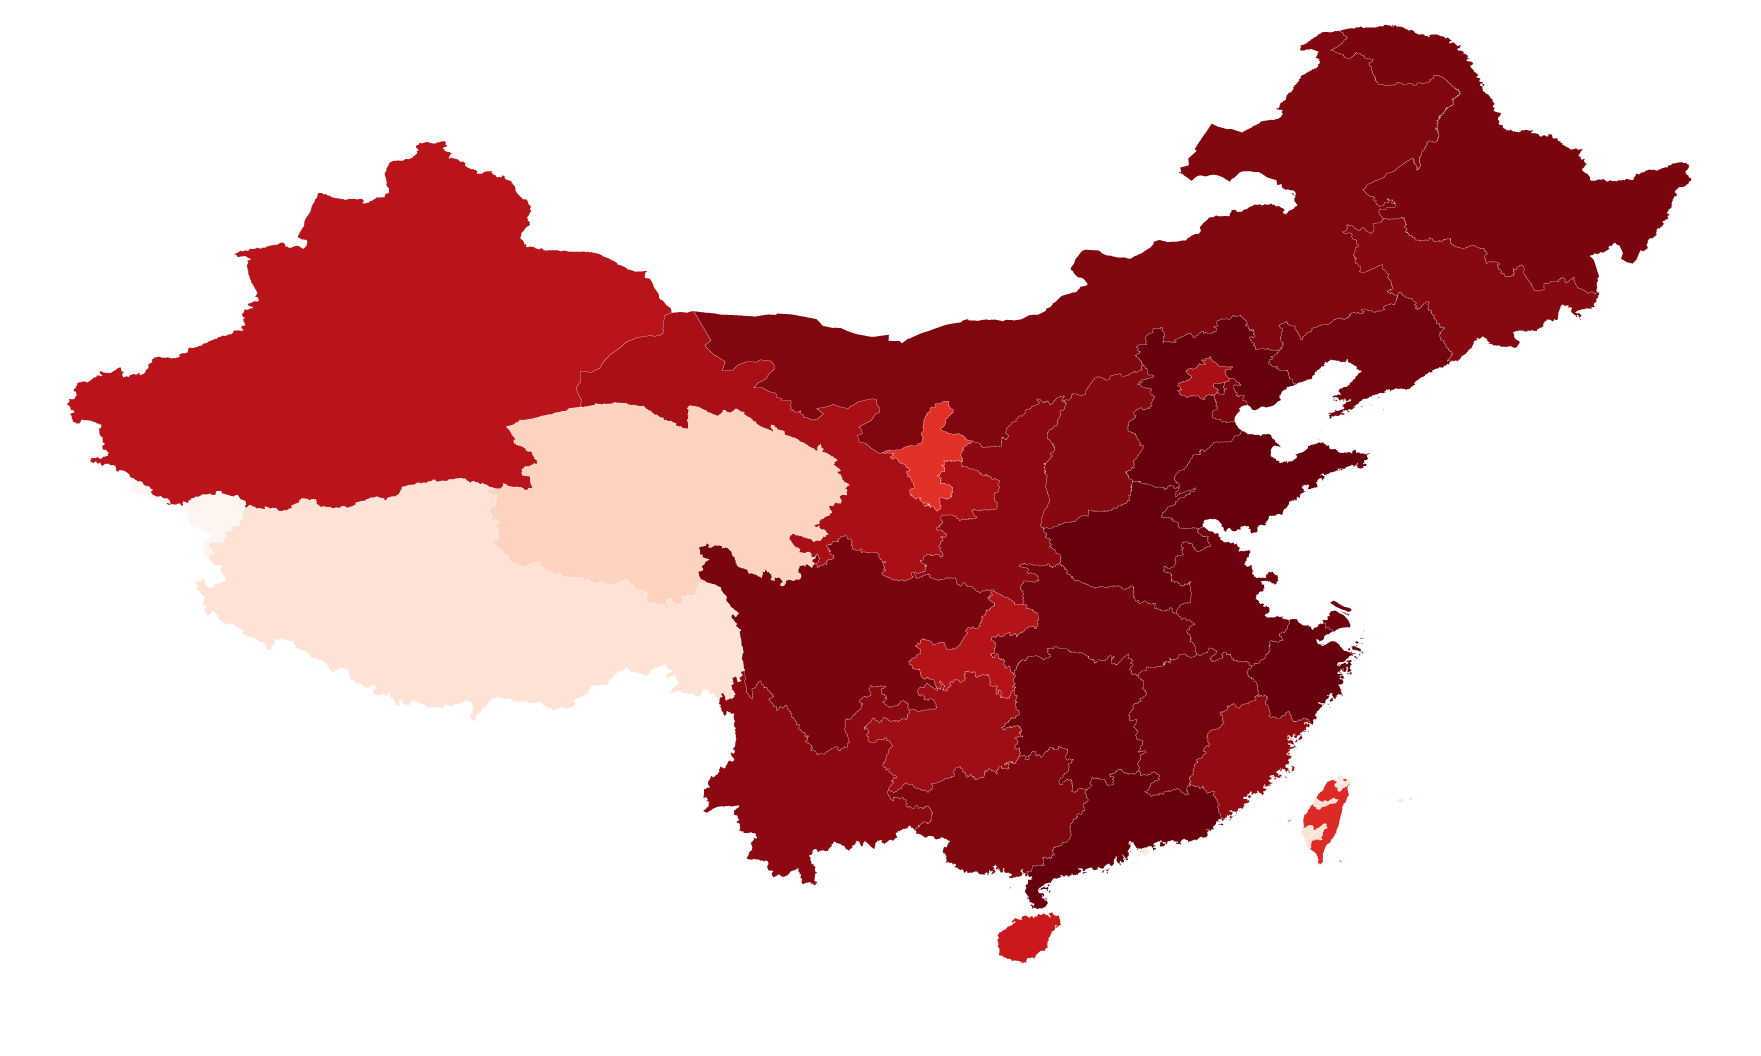
Key Findings:
- The top two most at-risk provinces in the world in 2050 are two of the largest economies in China – Jiangsu and Shandong. Each has a relatively diverse economy worth over a trillion US dollars.
- The economy of Jiangsu is highly developed and hinges on finance, education, technology and tourism as well as irrigated agriculture. Coastal Jiangsu on the Yangtze River Delta is already subjected to typhoons and in the last five years has experienced extreme flooding that has disrupted agricultural production and affected millions of people. China has invested significant capital in the building of sea walls and river floodgates in this province.
- Shandong province on the Yellow River is home to over 100 million people and is China’s third largest province by GDP and an important agricultural and industrial centre. Like much of eastern China, Shandong is subject to frequent flooding. Several catastrophic flooding events have occurred this century, including in 2022, against the backdrop of an overall drying trend.
- Guangdong on the Pearl River Delta is the biggest provincial economy in China by economic size and population. It is home to 126 million people and hosts Pearl River Delta Economic Zone and globally-significant ports on the South China Sea. Extreme flooding in Guangdong in 2022 caused an estimated 7.5 billion yuan in direct economic losses (over $1b USD).
- Projections are for extreme weather events in these regions to intensify in the coming years and the capital of Guangdong, Guangzhou has been estimated to be “the most economically vulnerable city in the world” to sea level rise by 2050 (IPCC AR6 WGII Chapter 10).
South East Asia
A focus on Aggregated Damage Ratio foregrounds large states and provinces with extensive built-up areas. Other parts of South East Asia rank among the highest in the world both for Average Damage Ratio and for the increase in damage from 1990 to 2050.
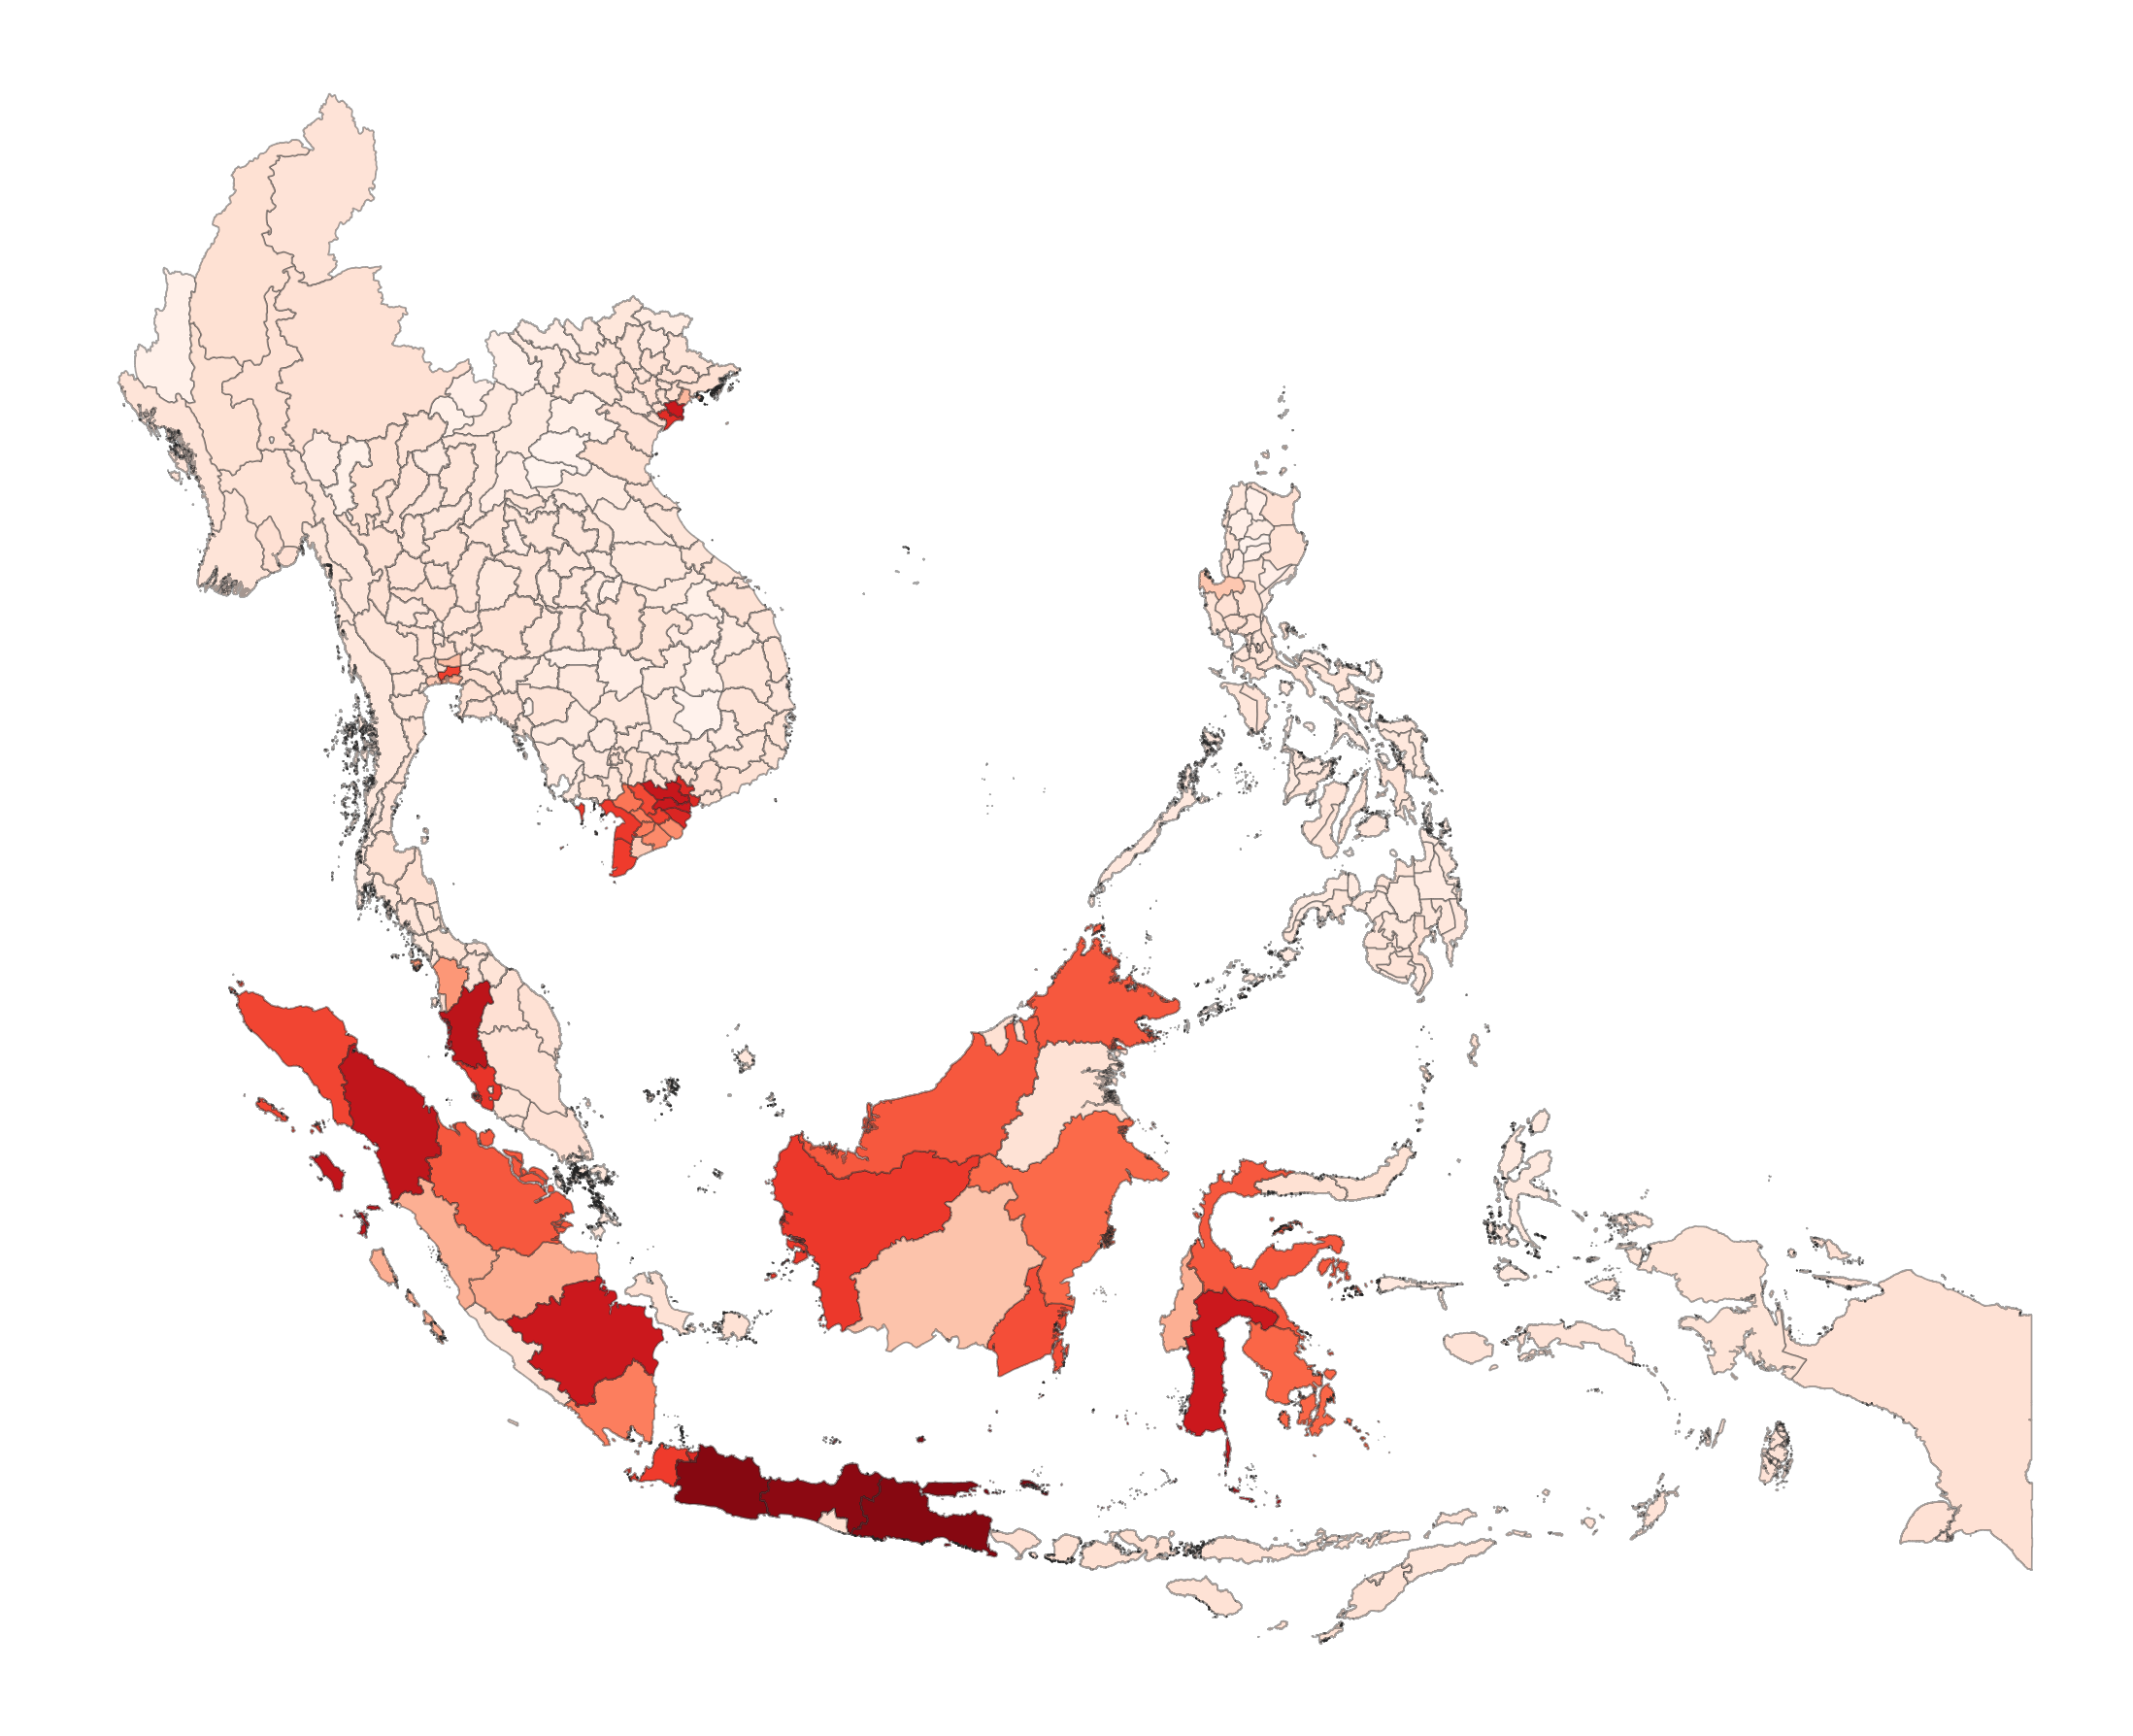
Key Findings:
- There are a number of provinces that rank high for both Aggregated and Average Damage Ratios in 2050. Many of these are in Vietnam, including Hồ Chi Minh City and Mekong Delta provinces like Long An, Vĩnh Long, Bến Tre, and Tiền Giang. The Mekong Delta is less than two metres above sea level on average, is home to 17 million people and produces most of Vietnam’s food.
- Other South East Asian provinces that rank high for both Aggregated and Average Damage Ratio include Jakarta, West Kalimantan (Kalimantan Barat) and Southern Sumatra (Sumatra Selatan)
- South East Asia experiences the greatest escalation in damage from 1990 to 2050. Among the places experiencing the highest percentage increases in damage to 2050 are islands in Mindanao in the Philippines, including the Sulu Archipelago, Tawi-Tawi and Camiguin.
United States
Three states in the US appear in the top 20 of the global ranking of states and provinces in 2050: Florida (10th), California (19th) and Texas (20th) and close to half of all US states are in the top five per cent (top 132) of those most at risk in the world.
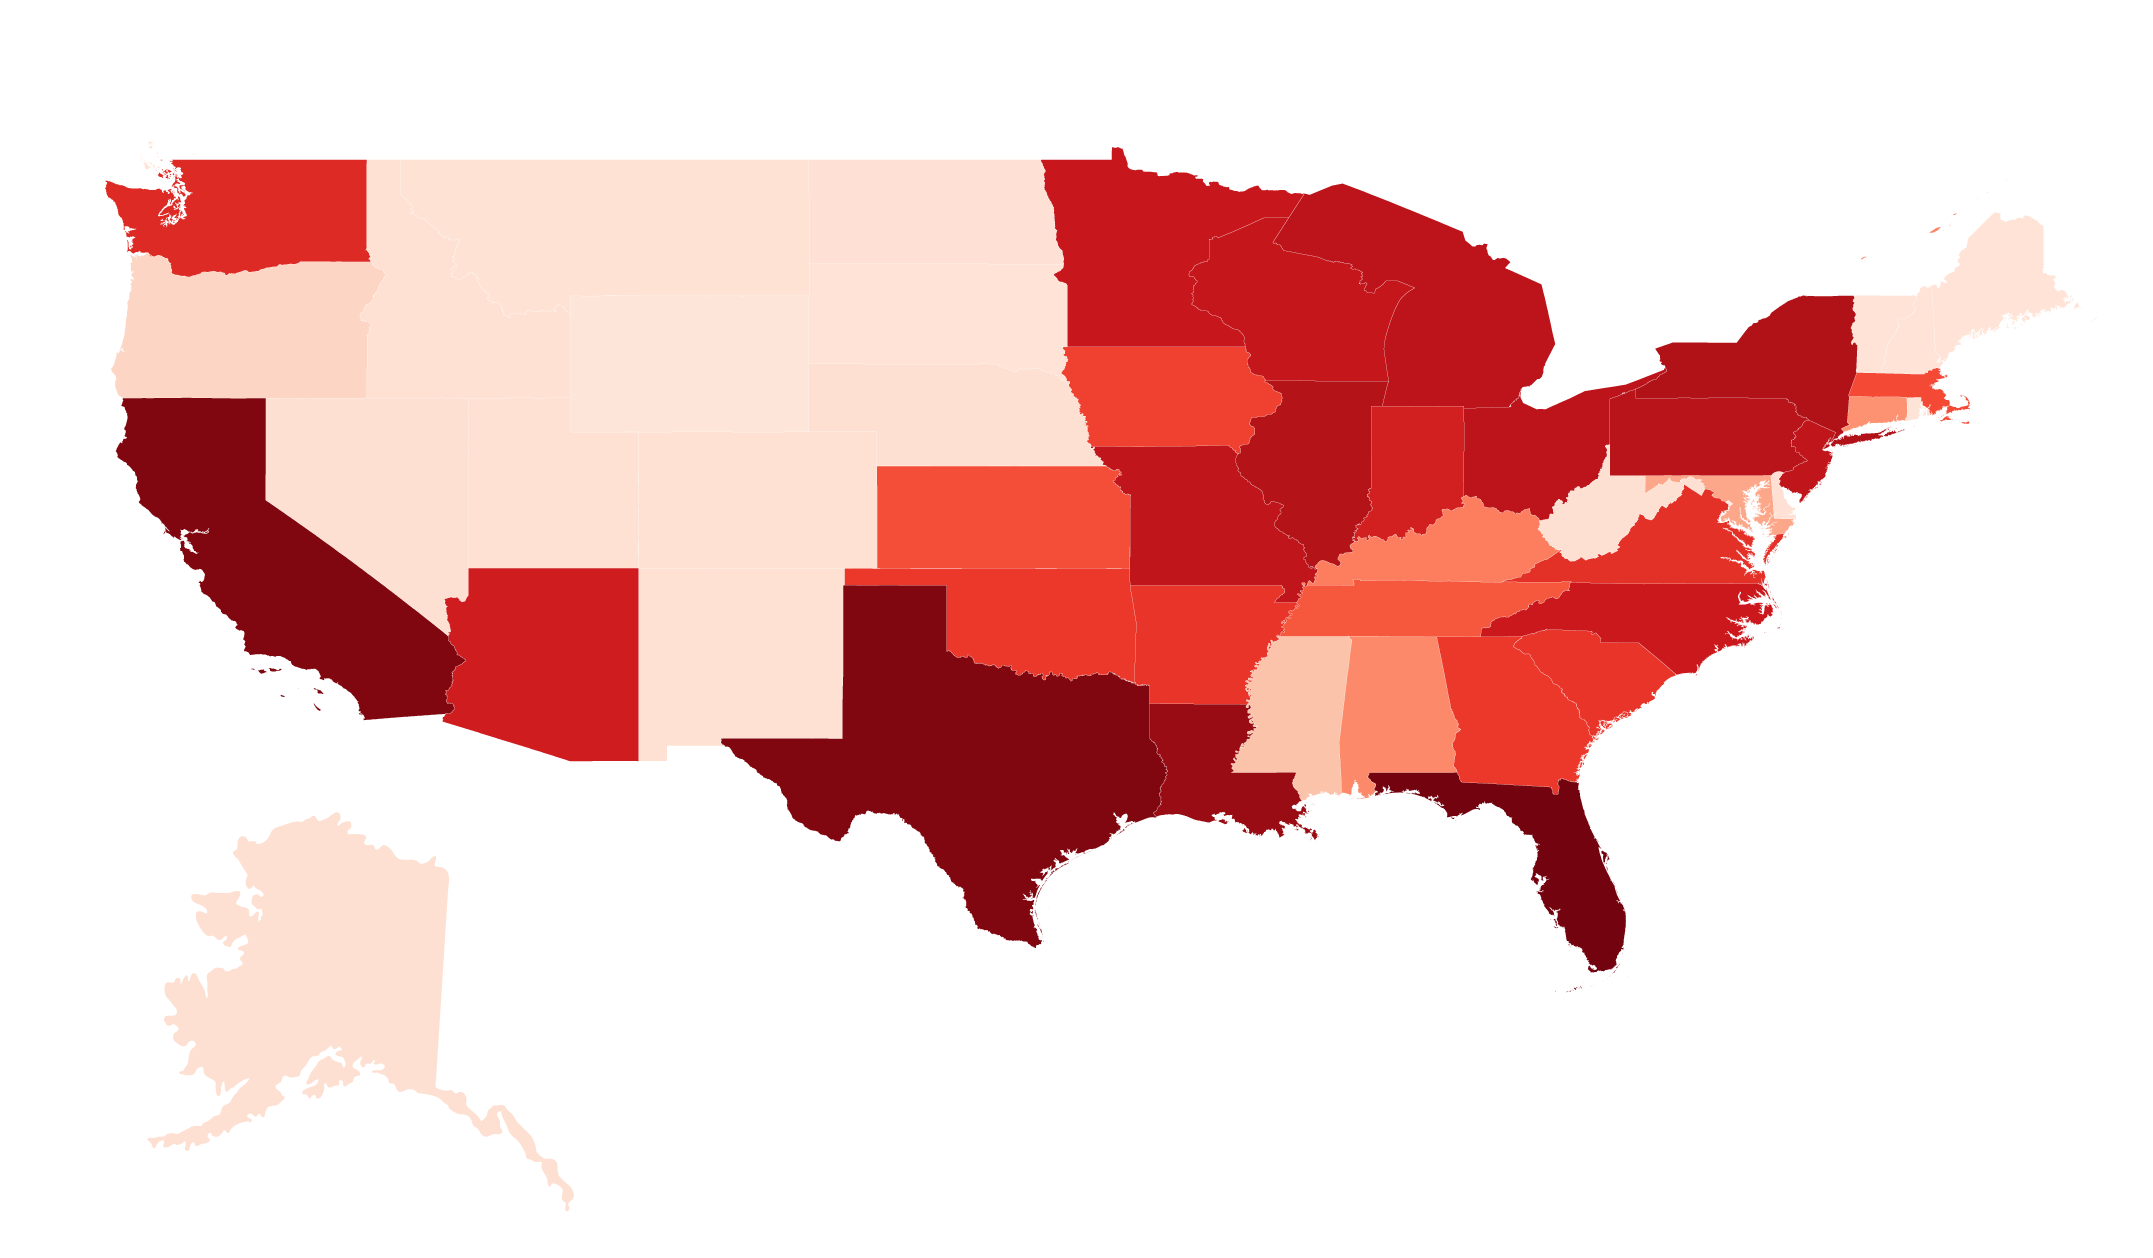
Key Findings:
- Sea level rise is a driving hazard for many states. The US Fourth National Climate Assessment found that sea level rise rates along the Mid-Atlantic Coast were three to four times higher than the global average rate. In the Mid-West, the highest ranking states are those that have both escalating risk from both flood and wildfire.
- The US has experienced 332 weather and climate related disasters since 1980 where overall damages reached or exceeded US$1 billion with the frequency of these events increasing in recent years. In the last five years, there’s been an average of 18 of these events per year.
- Florida, on the coast of the Gulf of Mexico, is the fourth largest state economy in the US, with gross domestic product of over a trillion US dollars. Florida is exposed to a number of climate-exacerbated hazards which are already manifesting, including increased number of extreme heat days, increased risk of wildfire, inland flooding and coastal inundation.
- The analysis in this ranking does not include additional climate change impacts expected in both Florida and Louisiana, such as escalating human health risk from mosquito-borne viruses.
- Louisiana is also on the Gulf coast and its major cities are in or beside the Mississippi River Delta. These cities and the coastline have already suffered the impacts of intense rainfall and flooding events, sea level rise and major hurricanes like Rita and Katrina.
- The analysis confirms the results of California’s Fourth Climate Change Assessment which estimated the state would experience US$113 billion in annual direct economic impact from climate change by 2050 without adaptation measures.
United Kingdom
Lincolnshire and Greater London are the UK’s highest-ranking counties, with damage risk for Greater London doubling between 1990 and 2050.

Key Findings:
- Lincolnshire and Greater London are the UK’s highest-ranking counties, with damage risk for Greater London doubling between 1990 and 2050. For Greater London in particular, the modelling assumes that the Thames barrage may not be able to keep up with rising sea levels and coastal inundation may become coincident with extreme flooding risk.
- Whilst English counties lead the UK ranking in terms of aggregated damage risk, Scotland sees the most significant increase in damage risk across multiple counties. In half of Scotland’s counties and a quarter of England’s counties, damage from extreme weather events is predicted to more than double between 1990 and 2050.
- Inverness in Scotland experiences the greatest increase in risk of damage anywhere in Europe, with a more than three-fold increase from 1990 to 2050. Shetland, Ross and Cromarty, Argyll and Bute and Nairn also see significant damage increases on 1990 levels. The highest-ranking Scottish counties occur where flood risk coincides with sea level rise.
- Most damage in the UK is caused by riverine and surface flooding or flooding combined with coastal inundation.
Oceania
Three Australian states – Victoria, New South Wales and Queensland – rank highest for Aggregated Damage Ratio in the Oceania region.
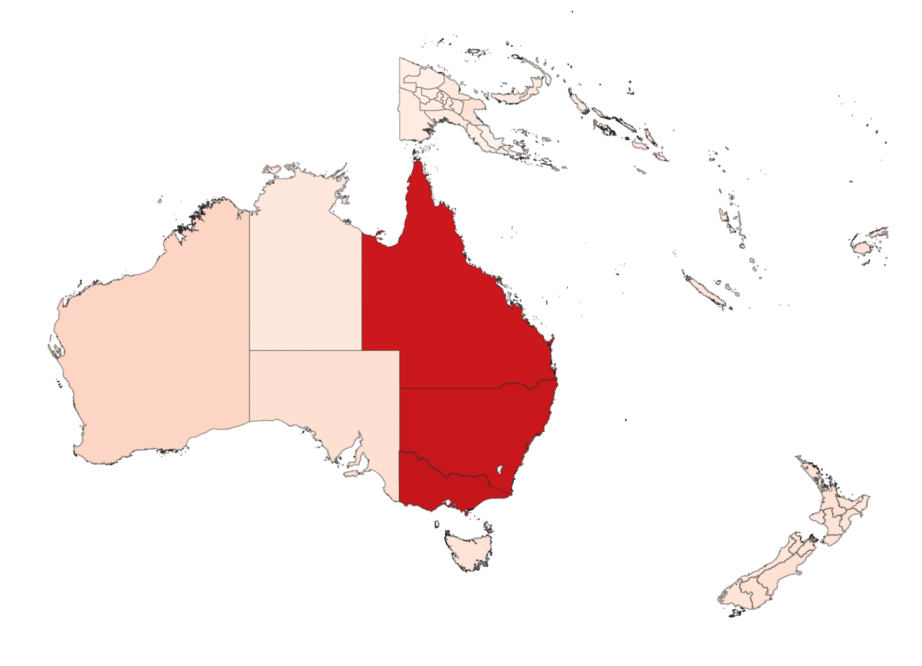
Key Findings:
- While the small island states of the Pacific are clearly known to be among the places most at risk from climate change due to rising sea levels and storm activity, the built environment focus of this dataset has highlighted risk in Oceania concentrated in developed and more highly populated areas.
- Viewed through the lens of risk escalation, several Papua New Guinean provinces rank highest for the increase in Damage Ratio from 1990 to 2050, with Southern Highlands and Gulf provinces experiencing a more than four-fold increase.
Read the full report for more.
For access to the full 2024 XDI Gross Domestic Climate Risk Dataset please contact:
[email protected].
See the full Gross Domestic Climate Risk ranking of 2,600+ territories
The XDI GDCR is the second release in the XDI Benchmark Series, ranking the physical climate risk to the built environment in all states and provinces around the world.
See the full 2,600+ territories below.
Statement on fossil fuels and weapons industry
XDI chooses not to provide services wholly directed towards enabling the expansion of fossil fuel production and use. Specifically, we will not provide physical risk analysis for new sites for coal mines, gas or oil fields or coal or gas-fired power plants. XDI recognises that many of our existing clients and resellers provide lending, consulting services or other support to the fossil fuel industry, including its expansion. XDI views our work as crucial to helping our clients understand the costs of catastrophic climate change and informing their business decisions and strategies such that they pursue pathways towards rapid decarbonisation and resilience. On a case by case basis, XDI may choose to add a company to the list of prohibited companies appended to this policy if XDI deems that company to be contributing to the expansion of the fossil fuel industry without appropriate plans to phase out these activities.
In view of the extensive and irreparable harm caused by the international weapons industry, XDI will not provide business services to companies that dominate this industry. XDI chooses not to provide services to companies, including their associated entities, whose business depends upon the continuation of war and conflict and the misery and environmental damage it inflicts. Specifically, XDI will not provide services to those among the 100 largest weapons manufacturers that derive 50% or more of their revenue from weapon sales. These companies will be those identified by the Stockholm International Peace Research Institute in 2021 or their associated entities.
News from XDI
Our latest updates

Why now is the time to embrace adaptation (and how you can get started)

2024 XDI Gross Domestic Climate Risk Report

XDI Hurricane and Tropical Cyclone Analysis
Contact us
Get in touch with one of our friendly team
Sales
Get expert advice on the best solutions for your climate risk scenarios
Help & Support
Support and help for our customers
Get support
Complete the form so we can connect you to the right specialist to support your distinct needs.
Media & Press
Fill in the form to get in touch with our media team
Contact our media team
We have an experienced communication and media team that can assist with media enquiries.
From simple, low cost analysis, to complex, detailed and specific,
XDI delivers actionable results
Our vision is not just to identify physical climate risks, but to mitigate them.
XDI can help you develop business plans for adaptation, helping you move from risk to resilience.
Talk to us today to find out more.
